
by Daniel Baker on 04-Aug-2017 13:00:00
Have you ever heard the saying "a picture is worth a thousand words"? Well, this saying perfectly summaries the whole point of infographics. Infographics are an increasingly popular form of content marketing, in fact, you could argue that infographics are giving videos a run for their money!

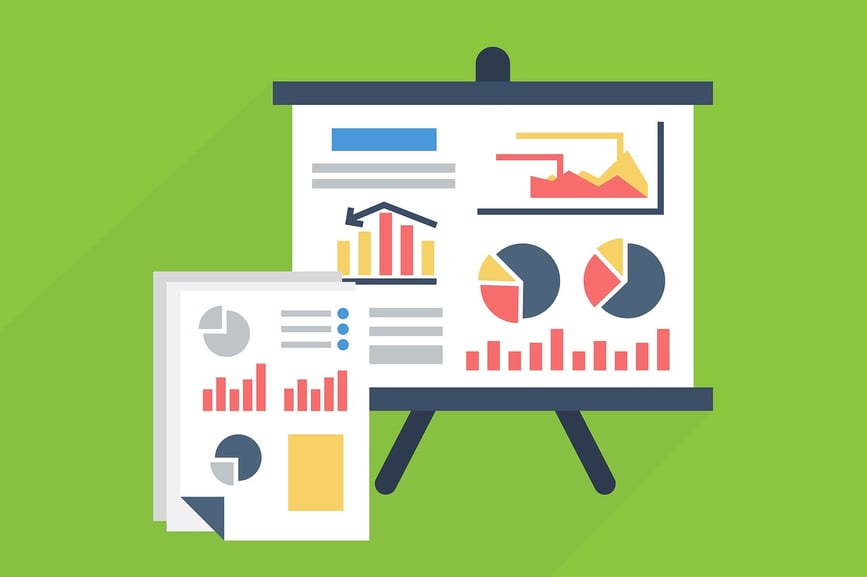
Infographics present information graphically - hence the name! The overall aim of an infographic is to convert a complicated (sometimes boring) topic into something that is simplified and captivating to read.
There is an endless sea of content floating around on the internet, this includes pictures, videos, sound files and articles. With this idea in mind it's very easy for your content to go unseen by your potential customers. This is where infographics truly shine; here's 6 reasons why every business (no matter your industry) should look into creating high quality infographics:
- Great At Grabbing Your Target Audiences' Attention! Humans are visual creatures, therefore it's no surprise to say that infographics are more captivating as opposed to reading a block of solid paragraph text on a webpage.
- More Memorable! The human brain can understand and retain visual information much easier than written text.
- Massively Increase Your Brand Awareness! You can brand your infographics through adding your website, your contact details and your brand colours.
- "Show Not Tell!" Infographics go beyond merely telling someone that you know what you're talking about. Instead infographics (especially professional, highly detailed ones) actually demonstrate that you know your industry inside and out, and that you can actually explain / present this information to a stranger in an engaging way.
- Social Media Sharing: The Ability To Go Viral! Online users are far more likely to share a visual piece of content with their friends and family. This is because infographics are colourful and less daunting compared to solid written text. People are also more likely to subscribe and follow your social media channels if your content looks imaginative.
- KPIs - Tracking With Analytics! You can easily embed an analytics code on your infographic to measure how many impressions, clicks and shares it receives in a given amount of time. Being able to analyse this type of information is extremely important because it allows you to see what your customers like and dislike about your online marketing.
So, How Do You Go About Making Infographics?
You can either ask a graphic designer to create your infographics for you or you can give it a go yourself. Two of the most common FREE platforms to use are Canva and Piktochart. I'd recommend signing up to both platforms and then have a play around - after all, practice makes perfect!
Just a friendly word of warning - if I were you I'd start off slow. Don't expect your first infographic to be an absolute mind-blowing masterpiece. I strongly recommend planning the content first in a word document. If you've previously written blog article like "X Tips On Gardening" you can reuse this content to create the infographic. After deciding your topic I would hop onto Pinterest or Google images to gain inspiration and look at possible templates you can emulate.
Top Tips
- Think of an imaginative title to hook your readers!
- Think of who your audience is. For example, business owners are more likely to trust infographics that focus on facts and graphs, whereas children will be more interested in infographics that portray a story through images.
- Make use of relevant images, icons, figures and graphs. Please ensure the images and icons you use are copyright free – you can use a website like Pixabay or Google images as long as you refine the search by clicking “tools” > “usage rights” > “labelled for reuse.” You can also download free icons off a website called Flaticon providing you credit the original source in the infographic. Please read the terms and conditions carefully to avoid copyright infringement.
- Stick to a theme / colour palette. The best-looking infographics use colours and fonts that complement each other. You can use online tools like Coolors to help you select colour schemes.
- Make use of white space. Don't overcrowd your document with too many shapes and contrasting ideas otherwise the infographic will look messy and unappealing.
- Ensure your font is easy to read and is a decent size. For body text I would recommend using size 18 or above as anything smaller will be unreadable if you decide to upload the infographic to Flickr, SlideShare or Pinterest.
- Keep an eye on how long your infographic is. I recommend a limit of 6,000 pixels otherwise your readers will be scrolling forever to read all the information. (In Pikochart to check the size click on “download” in the top right menu and the size dimensions will be displayed on screen. In Canva you'll need to download the infographic to your PC and then left click with your mouse and hit “file information” to view the overall size.)
- Always triple check any facts and figures you'll be using in the infographic because there is nothing worse than uploading inaccurate information!
- If you're using information from a third party you must reference the URL / source material at the bottom. Referencing will prevent plagiarism claims. References also add credibility to your infographic, therefore building trustworthy relationships with your customers.
- After completing the infographic please ask someone else to read the content to ensure it makes sense. After the infographic has been given approval, download the file as a PNG. or JPEG. and then upload it to SlideShare, Flickr and Pinterest. Other social media sites like Twitter or Facebook may not except the file if it is too big / long - but don't worry because you can always share the link from SlideShare, Flickr or Pinterest on your other social media profiles.
- Finally, you must correctly optimise your infographics to increase the likelihood of them being shown in the Google search results for the keyword you are targeting. Take a look at this article for further information on how to do this - SEO For Images: How To Optimise Your Photos, Logos & Infographics
Take a look at some of the infographics we've created below:
Are You Looking To Take Your Content Marketing To New Heights?
Infographics truly are an unbeatable way of displaying information about your industry, products and services. Adding your own unique style and design to your online content will give you the competitive edge over similar companies in your industry. Always remember that customers will only invest in businesses they trust - and therefore your content marketing is absolutely vital in building that relationship.
If you'd like help with any aspect of your digital marketing please contact the JDR Group. Our expert team can analyse your current marketing efforts and provide advice on how to improve for the future.
Image source: Pixabay

How To Market Your Small Business
Knowing where to start with marketing your small business can be tricky, as there is so much information out there it’s hard to know where to start.

25 Special Offer Ideas For Marketing My Business
Offers and incentives can be a great way to help replace the 5% - 10% of your customer base that every small to medium sized business loses each and e …

Which CRM Should I Use For My Business?
A customer relationship management (CRM) system is a highly useful marketing tool. When used properly, it can help you streamline your relationships w …